Wade, K Tech Review

Applet:
Adjustable Spinner
This applet is one of the interactives from NCTM’s Illuminations. (Click "Adjustable Spinner" to go to the applet.) It was designed for the use of Data Analysis and Probability exploration or activities. On the website the activity claims to be useful for grades Pre-K through high school.
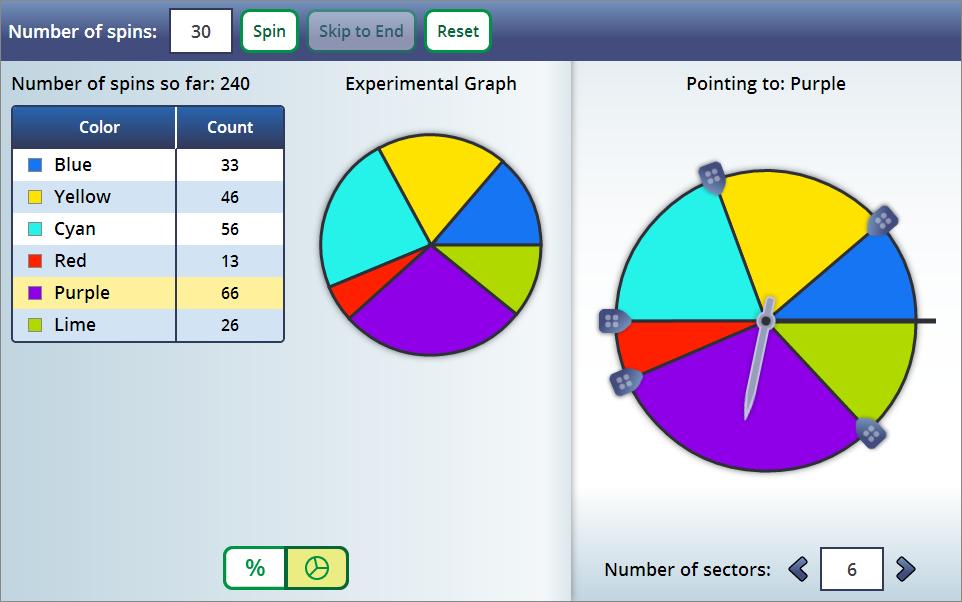
When you first go to the website, the spinner is divided into 6 equal sectors of different color. On the left side of the applet, there is a table of all the colors from the spinner and their counts. Then you can toggle between the percentages (theoretical and experimental) and pie graph of the experimental percentages. At the top of the applet, there is a box to type in how many spins you want the spinner to do (the applet allows any number from 1 to 1000). Then you click “Spin” to make the spinner go. If you type in a larger number, you can click the button “Skip to End” to automatically get your results without watching the spinner spin every time. As the spinner spins and lands on different sectors, the table of values will change. Every time the spinner lands on a color, it will add 1 to the count and the experimental percentage will change.
Adjustable Spinner
This applet is one of the interactives from NCTM’s Illuminations. (Click "Adjustable Spinner" to go to the applet.) It was designed for the use of Data Analysis and Probability exploration or activities. On the website the activity claims to be useful for grades Pre-K through high school.
When you first go to the website, the spinner is divided into 6 equal sectors of different color. On the left side of the applet, there is a table of all the colors from the spinner and their counts. Then you can toggle between the percentages (theoretical and experimental) and pie graph of the experimental percentages. At the top of the applet, there is a box to type in how many spins you want the spinner to do (the applet allows any number from 1 to 1000). Then you click “Spin” to make the spinner go. If you type in a larger number, you can click the button “Skip to End” to automatically get your results without watching the spinner spin every time. As the spinner spins and lands on different sectors, the table of values will change. Every time the spinner lands on a color, it will add 1 to the count and the experimental percentage will change.
Standards:
NCTM expectations:
Grades 3–5 Expectations: In grades 3–5 all students should–
o Describe events as likely or unlikely and discuss the degree of likelihood using such words as certain, equally likely, and impossible;
o Predict the probability of outcomes of simple experiments and test the predictions;
o Understand that the measure of the likelihood of an event can be represented by a number from 0 to 1.
Grades 6–8 Expectations: In grades 6–8 all students should–
o Use proportionality and a basic understanding of probability to make and test conjectures about the results of experiments and simulations;
Grades 9–12 Expectations: In grades 9–12 all students should–
o Understand the concepts of sample space and probability distribution and construct sample spaces and distributions in simple cases;
o Use simulations to construct empirical probability distributions;
o Compute and interpret the expected value of random variables in simple cases;
GPS:
{ MM1D1. Students will determine the number of outcomes related to a given event.
o a. Apply the addition and multiplication principles of counting.
{ MM1D2. Students will use the basic laws of probability.
o a. Find the probabilities of mutually exclusive events.
o b. Find the probabilities of dependent events.
o c. Calculate conditional probabilities.
o d. Use expected value to predict outcomes.
{ MM1D3. Students will relate samples to a population.
o b. Compare the averages of the summary statistics from a large number of samples to the corresponding population parameters.
o Understand that a random sample is used to improve the chance of selecting a representative sample.
{ MM2D1. Using sample data, students will make informal inferences about population means and standard deviations.
o a. Pose a question and collect sample data from at least two different populations.
o b. Understand and calculate the means and standard deviations of sets of data.
o c. Use means and standard deviations to compare data sets.
o d. Compare the means and standard deviations of random samples with the corresponding population parameters, including those population parameters for normal distributions. Observe that the different sample means vary from one sample to the next. Observe that the distribution of the sample means has less variability than the population distribution
{ MM4D1. Using simulation, students will develop the idea of the central limit theorem.
{ MM4D2. Using student-generated data from random samples of at least 30 members, students will determine the margin of error and confidence interval for a specified level of confidence.
Process Standards
{ MM2P1. Students will solve problems (using appropriate technology).
o a. Build new mathematical knowledge through problem solving.
o b. Solve problems that arise in mathematics and in other contexts.
o c. Apply and adapt a variety of appropriate strategies to solve problems.
o d. Monitor and reflect on the process of mathematical problem solving.
Activity with the Applet:
Here I have decided to use an example of a higher level activity to show the wide possibilities of this applet.
90% Confidence Intervals
The true interpretation of a 90% confidence interval is that 90% of confidence intervals made using a certain method will contain the true population proportion or mean. This is often lost in student understanding. Students usually go straight to "There is a 90% chance that the true population parameter is in this confidence interval," or "We are 90% confident that the true population parameter is in this confidence interval." While this is not incorrect, the true interpretation is important.
Put the students in groups of 3. Instruct the students to move the blue sector so that its theoretical percentage is 21%, this will represent a population proportion, and then tell students to toggle back to the experimental graph view.
For this activity we will choose a sample size of 200. Ask the students if this sample size is large enough and how do they know? (n*p > 15 and n*(1 – p) >15)
Students will use the applet to get a sample proportion of the spinner landing on blue. If calculators are not available for all the students, the t-value will be given (for a 90% CI, the t-value is 1.64) in order to construct the interval. Each group will construct 9 or more 90% confidence intervals. After all the intervals have been constructed, the teacher will get a tally of all the intervals that did contain the true population proportion and those that did not contain the true population proportion. The proportion of intervals that did contain the true population proportion should be approximately 90%.
Critique:
How well does it work?
This applet works very well. When larger numbers are used for spins, the experimental percentages do mostly approach the theoretical percentages. Also, when adjusting the sectors, it is possible to get percentages on every tenth of a percent (4.8, 4.9, 5.0, 5.1, etc.).
Are the written materials well organized and useful?
Not many written materials were provided with this applet.
“Change the number of sectors and increase or decrease their size to create any type of spinner. Then, conduct a probability experiment by spinning the spinner many times. How does the experimental probability compare with the theoretical probability?”
These instructions give the instructor a good place to start for thinking of an activity to go with the applet; however the instructions alone are weak and not very thought provoking.
In the exploration section, participants are encourages to start by spinning the spinner a few times and observing the experimental percentages. Then increasing the number of spins to 100 or more.
What are the purposes and goals for using this technology? Does the technology reach this goal?
I feel that the core purpose of this applet is for students to see that the more spins you do, the closer the experimental percentage is to the theoretical percentage, and the technology does accomplish this. However, this applet can also successfully be used for a broad array of mathematical (probability) goals. It can be used to simulate flipping a coin (by making it a two sector spinner) or rolling any number-sided die (up to a 12-sided die). You can also use this applet for showing sampling distribution of sample proportions. You even could go so far as to use the applet to display properties of confidence intervals of proportions.
Is the technology relatively easy to learn how to use?
This applet is very simple and easy to use. There are also instructions on how to use the applet. You only have to type in the number of spins.
Does this technology enhance or extend the teaching and learning process for the intended mathematics concepts? How and why?
It’s one thing to tell students that the larger number of trials you run, the closer the sample percentages approach the theoretical percentage. But when students can run the trials and see the effects of a larger number of trials themselves, they can have a better understanding of it.
Would you recommend this product for purchase to a school? Why or why not?
This is a free applet on NCTM, so all a school would need is access to computers with internet. It is not even required to have an NCTM account. But I would recommend this for any school. I feel like it’s a great simple tool with a lot of possibilities for data analysis and probability.
References:
National Council of Teachers of Mathematics. Math standards and expectations. Retrieved from http://www.nctm.org/standards/content.aspx?id=318.
Georgia Department of Education (2006). Mathematics Georgia performance standards. Retrieved from https://www.georgiastandards.org/standards/Georgia%20Performance%20Standards/Math-II-Stds-rev-0409.pdf.
The Common Core State Standards Initiative (2011). Common core state standards for mathematics. Retrieved from http://www.corestandards.org/assets/CCSSI_Math%20Standards.pdf
