Critique of Regression Applet
How well does it work?
Overall, the applet works very well. So far, I have not found anything withing the applet that glitches or miscalculates. All the features seem to work as they are intended to.
Are the written materials well organized and useful?
The written materials are well organized with four easy-to-read tabs.
Overall, the applet works very well. So far, I have not found anything withing the applet that glitches or miscalculates. All the features seem to work as they are intended to.
Are the written materials well organized and useful?
The written materials are well organized with four easy-to-read tabs.
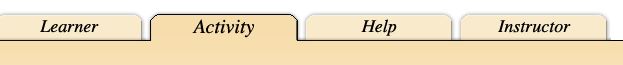
Under the "Learner" tab there is an explanation of regression models and related resources for the applet such as different activities, discussions, and worksheets that are available for download. Under the "Activity" tab is the applet itself. Under the "Help" tab are directions on how to use the applet. I found this tab to be extremely useful. It explains all the different aspects of the applet so that the users are not only aware of each feature, but can also use the applet appropriately. Under the "Instructor" tab users can find a description of the applet, what it can be used for, the different standards that are addressed by using it, related resources, and it also gives math topics that the teacher should be prepared to discuss with students prior to using this applet. Overall, Shodor.org provides a ton of helpful information to go along with this applet for the instructor and for the students.
What are the purposes and goals for using this technology? Does the technology reach this goal?
According to Shodor, "this regression applet is designed to allow the user to plot a bivariate data set, determine the line of best fit for their data, and then check the accuracy of their line of best fit. This activity determines the correlation coefficient, r, for the true lines of best fit and also exposes students to residuals."
I think this technology absolutely reaches these goals. In fact, I think the applet can go even further than that given the right activity to accompany the applet. With the "Move Points" and "Add/Remove" features, students can have a visual representation of how one point effects the line of best fit, without redoing the calculations by hand and only producing another regression model. I think this feature is incredibly beneficial because the students can see the change automatically. For example, if the one data point can change the linear regression model from y = 0.8x+1 to y = 0.5x+2, students may not understand how significant of a change this is until they see the change happen right in front of them.
Is the technology relatively easy to use?
Overall, the applet is easy to navigate and maneuver with a simple design that doesn't crowd the user's work space. Each button is fairly self explanatory, and all parts of the applet are color coordinated. The only thing that would make the applet easier to use is if the "Add Points," "Remove Points," "Move Points," and "Move Your Fit Line" would automatically released. I have found that sometimes I want to move add a point, but then when I want to move my fit line, I click on the line before "Move Your Fit Line" and it adds another point where I just clicked. Sometimes this point is hard to see, and could potentially skew data without students realizing it.
Some downfalls lie with removing points. Once a point has been removed from the data set, there is no getting it back unless the student manually enters it in the data box, or uses the "add points" feature. Personally, I think it would be nice if you could hide and show data points. Also, it would be nice if there was a way to click on a point in the scatter plot and see the coordinates for the point.
Does this technology enhance or extend the teaching and learning process for the intended mathematics concepts? How and why?
I believe this applet does enhance the teaching and learning process for the concepts and standards addressed. As previously stated, I think that the visual representation is huge benefit for the students, as well as being able to change and manipulate the data without getting bogged down in calculations. Because of this, I think students can dive deeper into the harder mathematical concepts such as what the correlation coefficient represents, how to interpret the slope and y-intercept of the regression model, and how residuals relate to the line of best fit.
Would you recommend this product for purchase to a school? Why or why not?
Because this applet is free, I would absolutely recommend that teachers implement it in their classrooms. The applet is easy to use, an can be beneficial for students as they study bivariate data. Although there are several other programs that allow students to do this, I think this one is easier to access than most and provides more resources than most applets do.
References
The Shodor Education Foundation, Inc. (2013). Regression. retrieved from: http://www.shodor.org/interactivate/activities/Regression/
The Shodor Education Foundation, Inc. (2013). Regression. retrieved from: http://www.shodor.org/interactivate/activities/Regression/
