About the Applet
This applet provides students with a means of identifying the characteristics of polynomial functions with degree 0 to 3. There are four sliders with which the student can manipulate what function is graphed. Slider a controls the x^3 coefficient, b the x^2 coefficient, c the x coefficient, and d the constant.
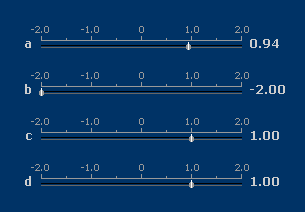
Therefore, linear, quadratic, or cubic functions can be graphed. The four check boxes indicate which characteristic of the function is being identified.
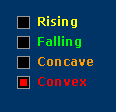
These characteristics are color coded so that students can see where on the graph the characteristic takes place. Below the check boxes is the function itself, f(x).
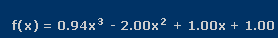
Directly below this a function value for a given x-value.

Moving the slider directly below the graph can change this x-value.
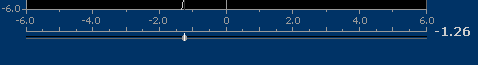
Below the function value are x- and y-coordinates that tell the coordinates of the point the mouse is hovering over.

Horizontal and vertical lines intersect at this point.

Unfortunately, there are no written materials to accompany this applet, but there are spaces on the webpage for someone to submit them, such as an activity, theory, and demo.
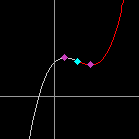
There is an applet help file for users who have difficulty using the applet. This document says that the function value given near the bottom of the applet is marked with a white diamond and “ghosted struts.” Violet marks are extrema while blue cyan marks are points of inflection.
There is an applet help file for users who have difficulty using the applet. This document says that the function value given near the bottom of the applet is marked with a white diamond and “ghosted struts.” Violet marks are extrema while blue cyan marks are points of inflection.
The point where the mouse hovers and the crosshairs (horizontal and vertical line) disappear if the mouse is clicked.
The fact that the violet and blue cyan points are not identified in the applet gives this a more exploratory appeal. Students can figure out for themselves what these points mean in the context of the function in which they have graphed. This can occur before or after students have learned about the characteristics in question.
The fact that the violet and blue cyan points are not identified in the applet gives this a more exploratory appeal. Students can figure out for themselves what these points mean in the context of the function in which they have graphed. This can occur before or after students have learned about the characteristics in question.
